Reservoir Modeling of Oil Sands
The reservoir, called the oil sands layer, is a complex mixture of sand and mud layers with various thickness and proportions, of which the sand layer contains ultra-heavy oil called bitumen.
JAPEX had been involved in the exploitation of the oil sands layer in Canada since 1978, and contributed to the establishment of a bitumen production method called the Steam-Assisted Gravity Drainage (SAGD) method. To improve the production efficiency of bitumen using the SAGD method, we used geological modeling technology with multiple-point geostatistics.
Note) Ended our participation in the oil sands project of the Hangingstone Leases in Alberta, Canada in September 2021.
Geostatistics and Oil Development
Geostatistics is a statistical science that models and characterizes the spatial and temporal relationships of various phenomena in nature. It is one of the fields of applied mathematics that evolved from the prediction of underground reserves of natural resources.
Application in Oil Development
Geostatistics plays a crucial role in oil development to evaluate reservoirs and delineate their distribution. One of the best geostatistical methods that can reflect the formation process of the strata is the multiple-point method.
JAPEX has been focusing on the potential of the multiple-point method since the research stage and has been working on its practical application in oil development. The multiple-point method can reflect a sedimentary context controlling the formation of geological strata. We can consequently construct a geological model that represents the distribution of sand and mud layers using the multi-point method. In the multiple-point method, we first create a training image reflecting the sedimentary system, and then extract patterns from the image to construct a geological model that incorporates the sedimentary system.
In the development of oil sands in Alberta, Canada, we evaluate heterogeneity in the distribution of sand and mud layers based on the geological model we have constructed for the oil sand layer, which is a complex formation, in order to improve production efficiency. In another project, we employ the multiple-point method to build and evaluate geological models of complex reservoirs such as volcanic rock reservoirs.
Oil Sands Layer Modeling Process
In oil sands layers, where sand and mud layers are intricately mixed, mud layers works as a barrier to the steam injection by the SAGD method, resulting in lower production efficiency.
The oil sands layer developing by JAPEX in Alberta, Canada, is believed to have deposited under a meandering river environment. Based on this assumption, the oil sands layer is divided into two types of deposits: point-bar deposits and abandoned-channel deposits. The distribution of sand and mud layers (lithology distribution) within each type is estimated in a four-step workflow.
- Point-bar deposits: Deposits of sand grains transported by moving or rolling them along the river bottom and mud grains transported by floating them. They have accumulated inside the meandering stream channel
- Abandoned-channel deposits: Deposits that filled in abandoned channel that was cut off from the mainstream as an oxbow lake due to repeated meandering of the river.
Four-step Workflow
- 1) Interpret the distribution of point-bar and abandoned-channel deposits based on 3D seismic survey and well data.
- 2) Build a framework model based on (a).
- 3) Create a training image that reflects the sedimentary system (depositional/erosional process) in the point bar.
- 4) Build the distribution model of sand and mud layers in point-bar deposits using the multi-point method, and the distribution model of sand and mud layers in abandoned-channel deposits using the two-point method.
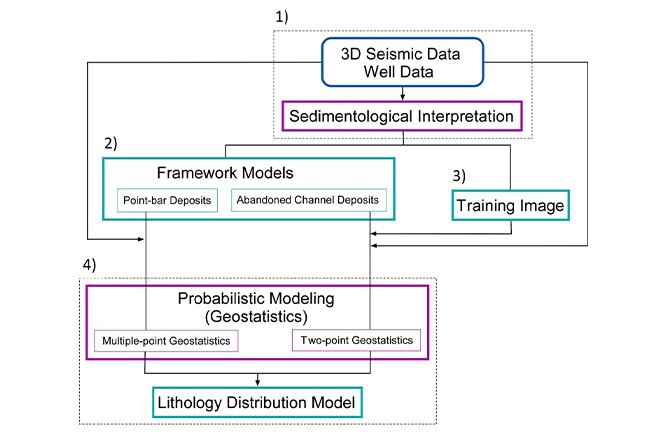
Geological model construction workflow
(Source: Tsuji et al. 2013 (c) The Geological Society of Japan *1)
1) 3D seismic survey and well data interpretation
Fig. a) shows 3D seismic data. The colored lines in Fig. b) are interpreted as depositional/erosional surfaces within point-bar deposits and the walls of the abandoned channel. In this case, the well data is used to aid the interpretation.
In Fig. c), the colored lines interpreted in Fig. b) are selected and integrated to build a framework model.
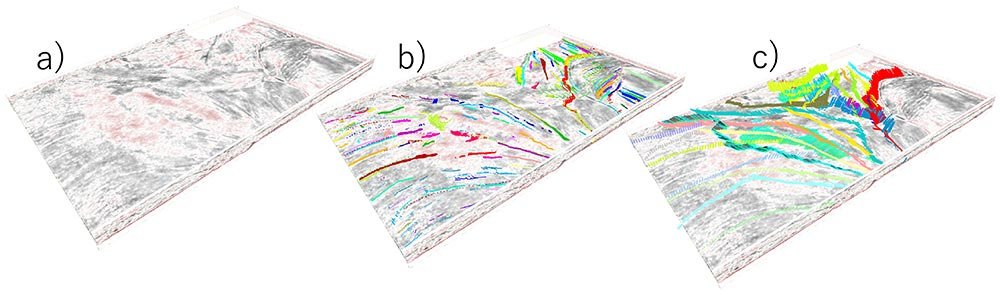
Procedure of 3D seismic data interpretation procedure
(Source: Tsuji et al. 2013 (c) Geological Society of Japan *1)
2) Building a framework model
Build a framework model based on the interpreted lines drawn in Fig. c) in 1).
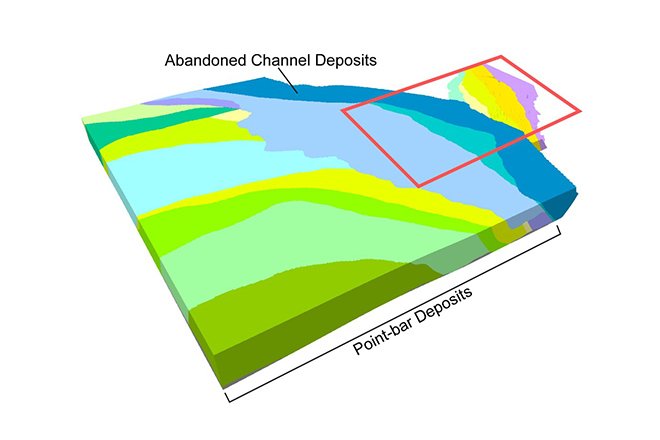
Framework model representing the distribution of point-bar deposits and abandoned-channel deposits
(Source: Tsuji et al. 2013 (c) The Geological Society of Japan *1)
3) Creating a training image
Create a training image that reflects the depositional/erosional process in the point bar environment
- A: Create a number of point-bar subunits showing the distribution of various possible sand and mud layers
- B: Stack the subunits considering the depositional/erosional process in the point bar
- C: An example of a training image built by staking subunits
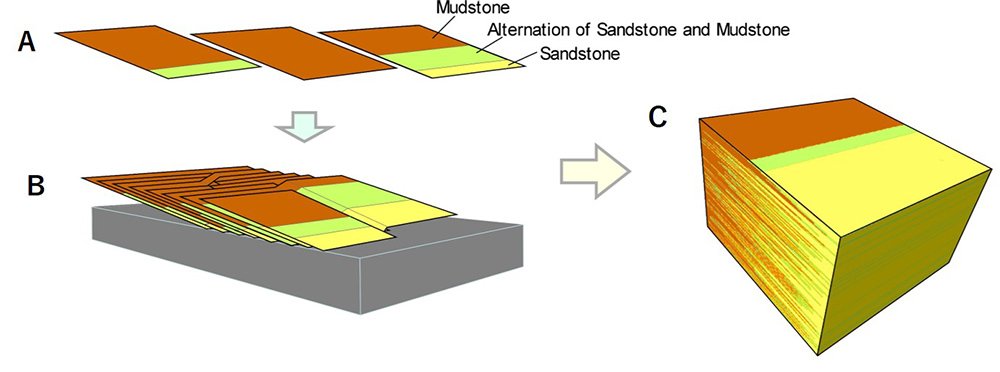
The concept in building a Training image for lithology distribution of point-bar deposits
(Source: Tsuji et al. 2013 (c) The Geological Society of Japan *1)
4) Building a geological model
This is an example of a geological model (sand layer and mud layer distribution) constructed using the multiple-point and two-point methods. The constructed model is partially cut out and used to predict the performance of production with the SAGD method.
- In building a model, sand layer and mud layer distribution data observed in wells are used as hard data, and the probability of occurrence of sand layer and mud layer are used as soft data.
- The probability of sand and mud layers is calculated based on the relationship between 3D seismic data and well data.
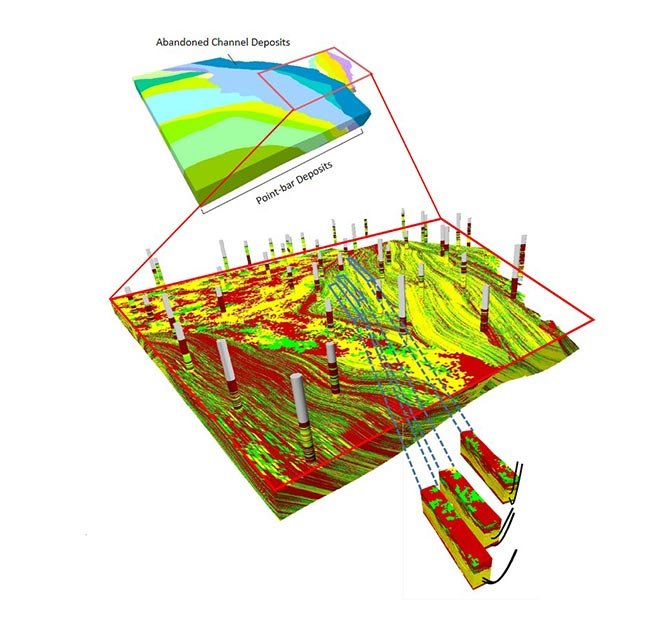
An example of a lithology distribution model
(Source: Tsuji et al. 2013 (c) The Geological Society of Japan *1)
(Source)
*1: Takashi Tsuji, Osamu Takano, Satoko Watanabe, Kinya Okada, Koji Kashihara, Koji Kawada, Arata Katoh, and Koichi Nakagami, Lithology distribution model of point-bar dominated meandering river deposits for uncertainty quantification., 2013, Jour. Geol. Soc. Japan, 119, 8Our website uses cookies to improve the convenience of our visitors when browsing our site. If you agree with our policy on the use of cookies, please click the "Agree" button. If you do not agree to the use of cookies when browsing our website, please disable the cookie setting in your browser.